


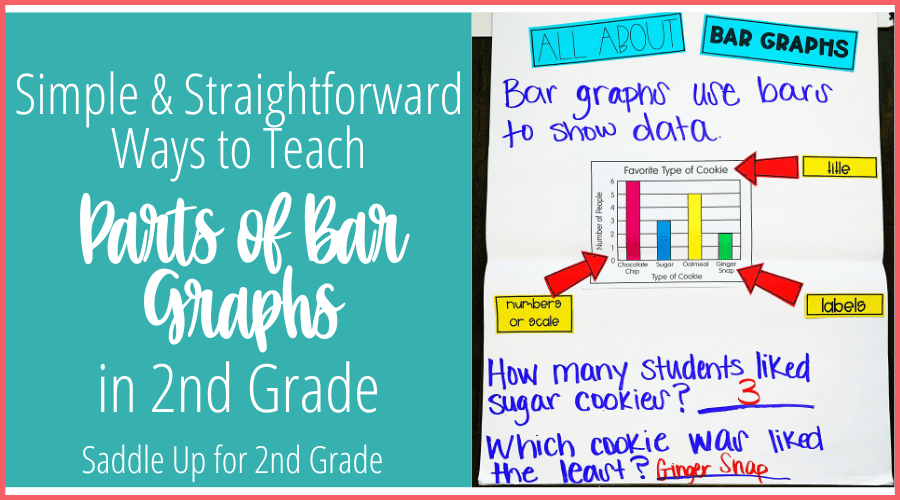
As a 2nd grade teacher, one important mathematical standard you will teach your students is graphs and data representation. One of the most commonly used graphs in the elementary grades is the bar graph. In this blog post, we’ll explore simple and straightforward ways for how to teach graphs to your 2nd grade students as well as the parts of bar graphs.
A bar graph is a visual way to display and compare data using rectangular bars of varying lengths, either vertically or horizontally. The height or length of each bar represents the frequency or quantity of a specific category or value. Bar graphs are often used to show changes in data over time or to compare data from different groups.
You can watch my YouTube video, Bar Graphs in the Classroom for 2nd Grade, to learn more about what a bar graph is and how to teach graphs to your students.
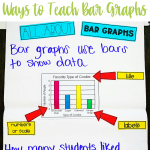
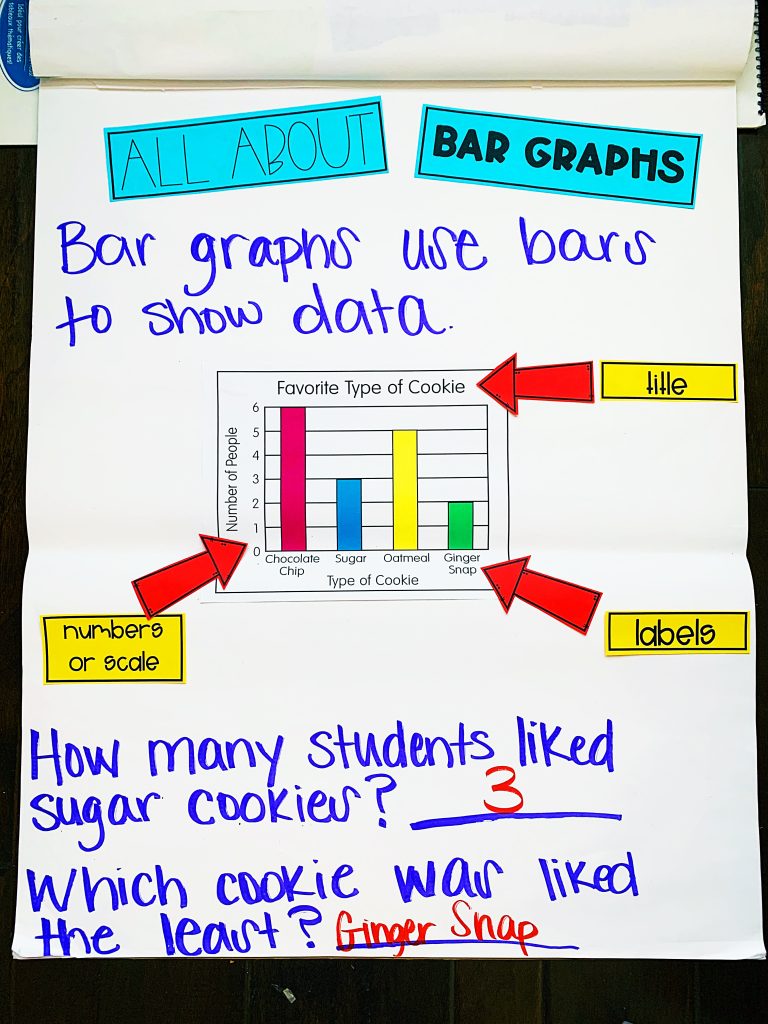
Before teaching your students how to create a bar graph, it’s important to first understand the parts of bar graphs and what they mean. I like to use a whole group bar graph anchor chart to introduce students to the key parts of bar graphs and to show bar graph examples.
As we create this anchor chart together, this is a great time to incorporate mathematical vocabulary words and discussion.
The key parts of a bar graph are:
This is a brief description of the data being represented in the graph. The title of a bar graph should be short, clear, and concise.
The scale on a bar graph shows a set of numbers that help measure data. It shows the way that numbers are used in the bar graph. Depending on what grade level is being taught, a scale can have different number patterns such as counting by 1’s, 2’s, 5’s, or 10’s.
Labels are placed along the axis of a graph to show exactly what is being measured. Rectangular bars are shown above each label to represent the value of that category on the graph. They are usually color-coded or shaded in for easy differentiation.
After students understand the parts of bar graphs, they’re ready to learn how to create a bar graph, show, and collect data.
To model this, I like to use blank anchor chart paper and sticky notes to teach students how to create a bar graph. You can laminate a blank piece of anchor chart paper so that it can be used over and over again with a dry erase marker or you can create a new graph each time on different paper.
In my guided math unit for 2nd grade, they will create a different whole group bar graph each day to practice this skill and become more familiar with it.
Model the steps for creating a bar graph and ask students mathematical questions such as where the title should go, where the labels should go, etc. If you want to challenge them, you can even place items in the wrong place and have your students correct them.
When creating a bar graph with your students and teaching them the process, there are a few key steps to follow.
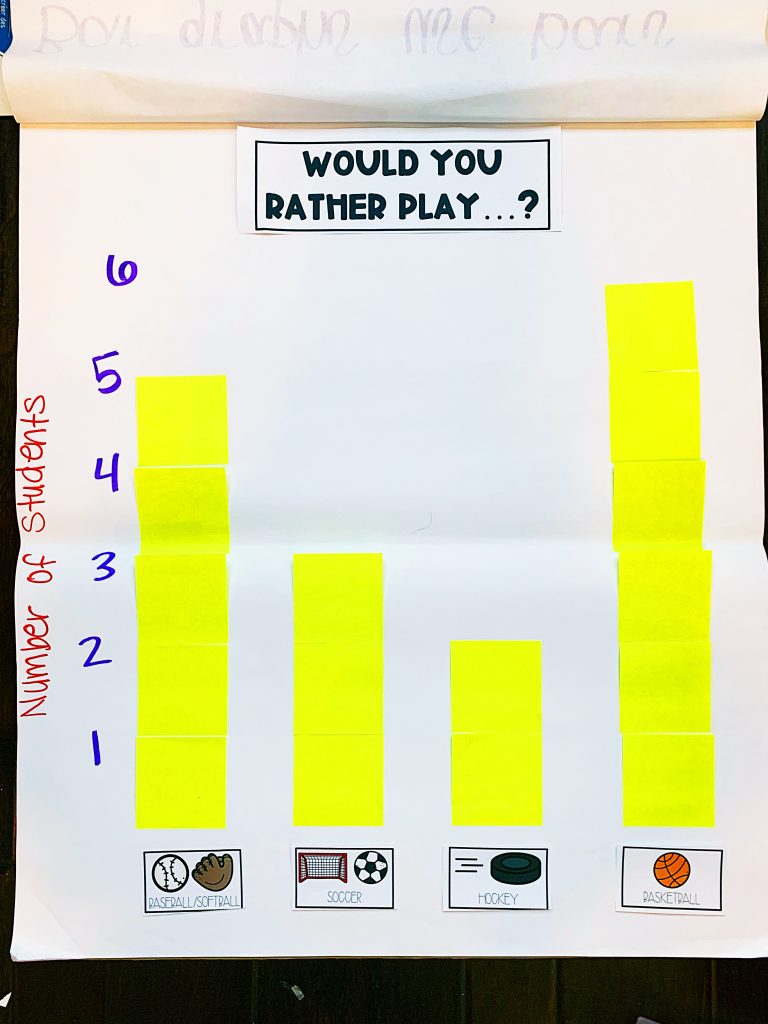
Decide on a topic that your students will find interesting and relevant. Then, determine a title for the bar graph that fits that topic as well as the labels being used. In this example, students create a class bar graph based on which sport they would rather play. Each sport is represented with labels.
Next, have students determine the numbers or scale being used to measure the data. In this example, each student represents 1 vote, so the scale is counted by 1’s.
Now it’s time to collect data related to the topic. In this bar graph example, each student is given a sticky note to represent one vote for their sport of choice.
Students will use the data collected to create the bars on the bar graph. Allow them to come up and place their sticky note onto the anchor chart paper above the label of their choosing. The sticky notes create large rectangular bars on the graph to show the data.
After creating a bar graph, I like to use a set of mathematical question stems to ask students questions about the data represented on the bar graph they created. This helps them think critically and use the data on the bar graph to find the answers.
When teaching bar graphs to your 2nd grade students, there are a few tips to keep in mind to make your students more successful with this skill.
Using real-life bar graph examples that are relatable to your students, such as their favorite foods, toys, animals, or something that interests them, is effective to help students grasp the concept and stay engaged in your lessons.
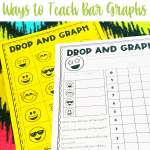
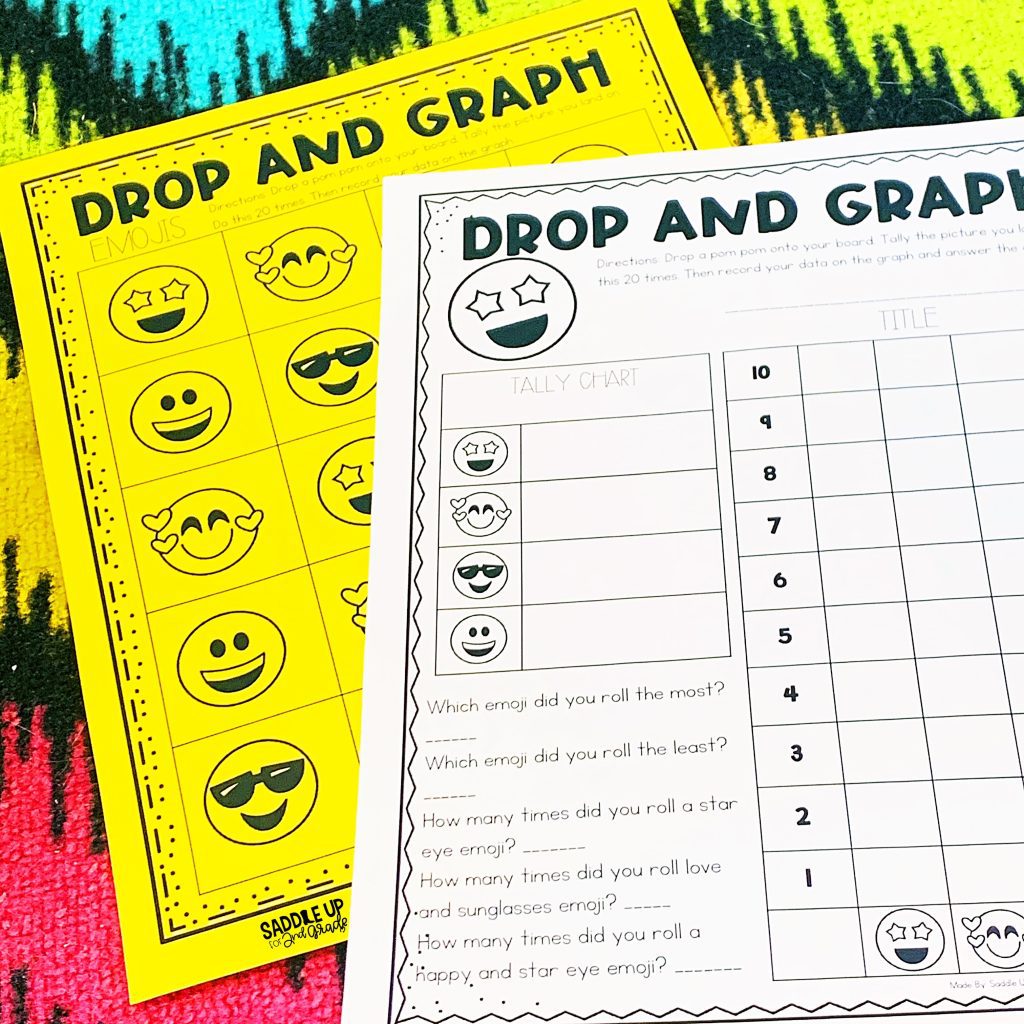
In this activity example, students play Drop and Graph with emojis. Each student gets an emoji board and a pom pom ball. They drop their pom pom onto the board and then record their data based on which emoji they landed on. They repeat this process 20 times, tally their results, and create a bar graph before answering questions about the data shown.
The next tip is to begin with simple bar graphs that have only a few categories or values to help your students understand the basic concepts. You can integrate bar graphs with other mathematical concepts your students have already learned to make those connections.
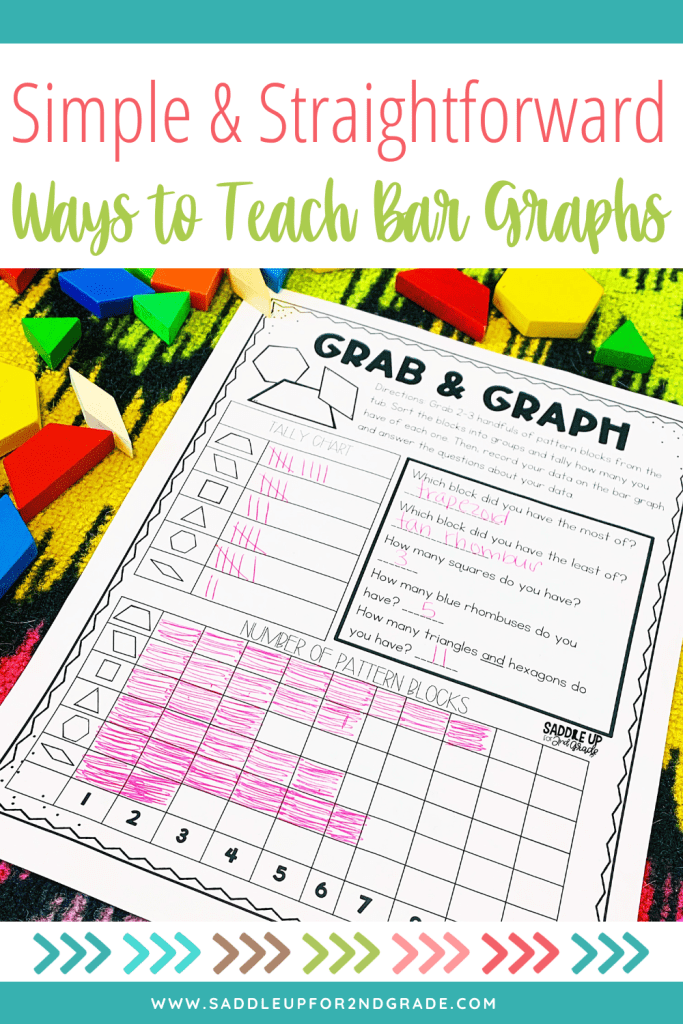
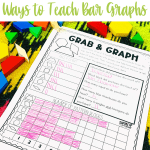
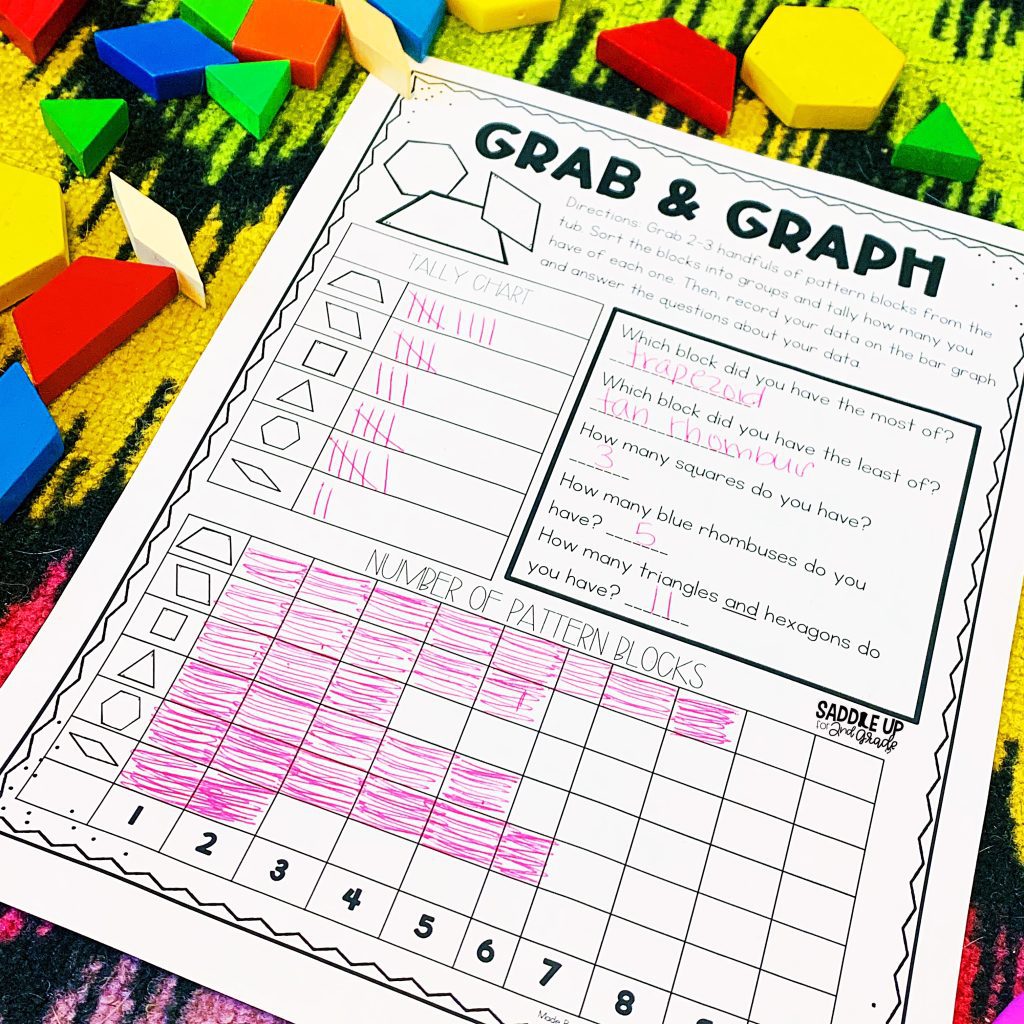
There are so many ways to do this, such as by using an activity like Grab and Graph. Students will grab a handful of pattern blocks out of a tub and tally the results. Then, they’ll use the data when creating a bar graph and answering questions. This also integrates geometry into their graphing lessons.
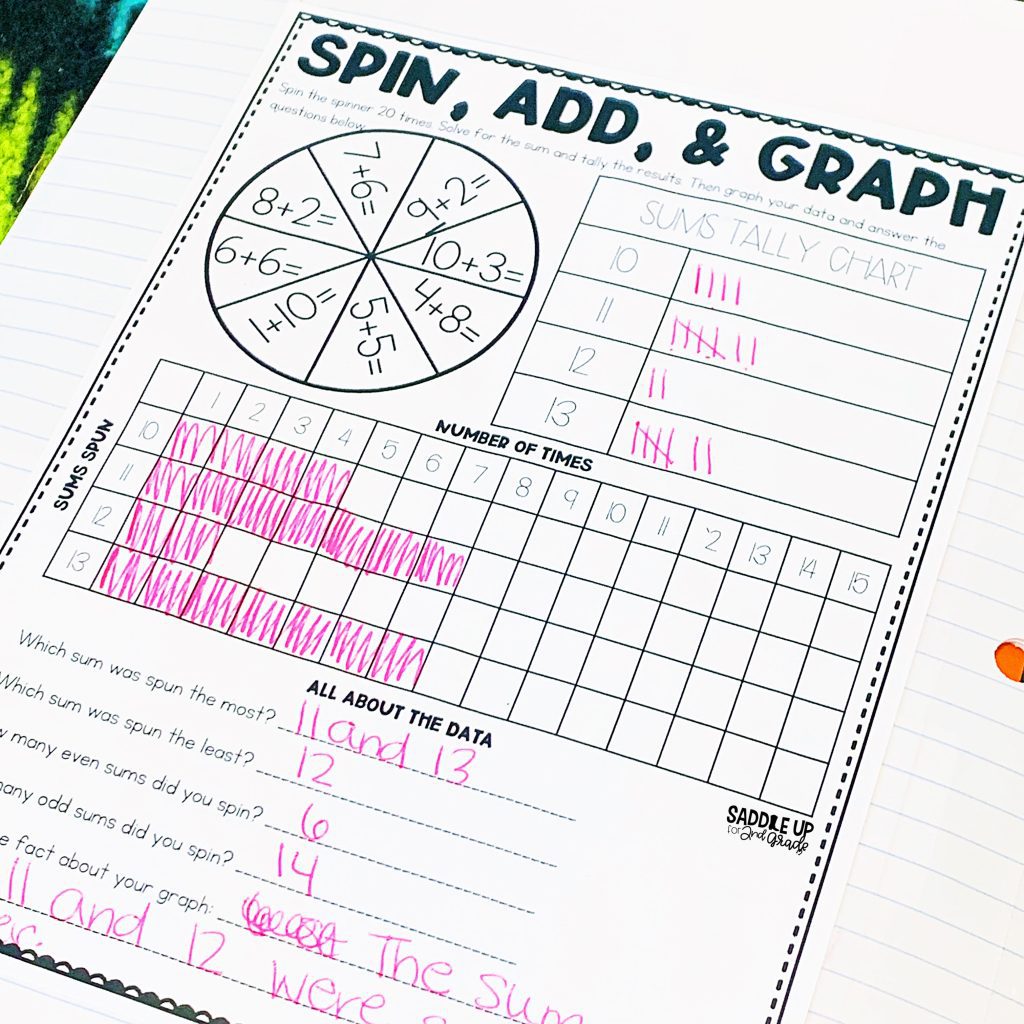
Another simple way to practice bar graphs along with addition facts is to use this Spin, Add, and Graph activity. To play, students will spin a spinner, solve the math fact they land on, and tally the sum. They’ll repeat this process multiple times before graphing their results on a bar graph and answering questions about their data.
Using colorful visuals and hands-on activities, such as drawing and coloring bar graphs, is an effective way to help your students visualize bar graphs and understand the data being represented.
You can do this by incorporating different coloring utensils, math cubes, and colored sticky notes.
As you teach bar graphs to 2nd graders, reinforce key mathematical vocabulary words, such as “title,” and “scale” throughout the lesson to help your students remember the parts of a bar graph.
The more students hear and use these terms in context, the more the concept will stick.
If you’re a 2nd grade teacher looking for more hands-on and engaging activities for your students to learn the parts of bar graphs and practice creating bar graphs, look no further than my 2nd Grade Graphs and Data guided math unit!
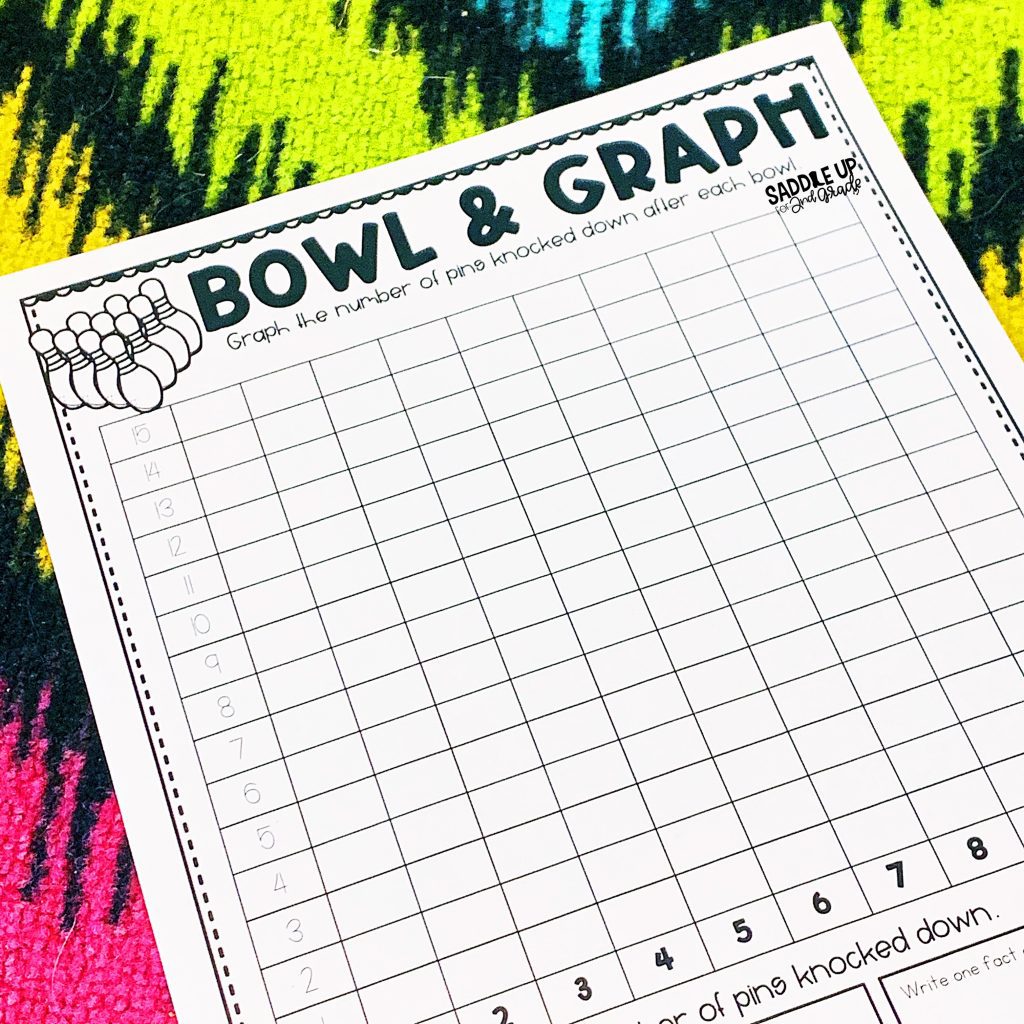
You’ll find all of the activities and anchor chart templates shown in this blog post, plus more activities such as Bowl and Graph and Mustache You a Question, shown below.
You can use a plastic set of bowling pins or plastic cups and a ball for Bowl and Graph. The Mustache You a Question activity is a fun way to practice graphing and data while encouraging students to get active and interact with their classmates.

Teaching bar graphs and the parts of bar graphs to your 2nd grade students can definitely be fun, engaging, and effective, all at the same time.
Use real-life bar graph examples, visuals, simple graphs, and hands-on activities while incorporating key vocabulary words into your lessons to help students develop an understanding of using bar graphs to represent data and solve problems.
With these tips and activity ideas, they’ll be mastering graphs and data in no time!
If you’re looking for more ways to help you teach graphs and data in your classroom, check out these resources below in my website shop! You can also find them in my TPT store.
I’d love to know in the comments, what is your favorite activity for teaching bar graphs?
Be sure to pin this image to save this post for later!