

Have you ever wondered how to make interactive anchor charts more exciting and engaging in your classroom (so they’re actually helpful and not just a hassle?). What is the difference between anchor charts and posters anyway? In this blog post, I’m answering all of these burning questions and sharing 5 excellent anchor chart examples to help you engage your students and make anchor charts more effective in your classroom!
This is part 2 in our anchor chart series, so if you haven’t yet, be sure to check out part 1: Getting Started With Anchor Charts in the Classroom The Easy Way!

This post contains affiliate links. You can see my disclosure here.
Interactive anchor charts are meant to actively involve students in the creation process. When students are a part of the process and can share their ideas and creativity, they’re more likely to take ownership of their learning. Plus, it’s more likely that the content and strategies being taught actually stick.
Luckily, making anchor charts interactive is super easy. The real key is… sticky notes! Lots and lots of sticky notes!
Before we dive into interactive anchor charts and the anchor chart examples, I want to clear up a common misconception that teachers have.
Posters are:
Anchor charts are:
I’ve heard from so many teachers on Instagram and in my Saddle Up For 2nd Grade Teachers Community that they WANT to use anchor charts in their classroom, but they need to be able to maximize their instruction time and engage their students in the learning so the anchor charts are more meaningful and worthwhile.
Check out my YouTube video below for some anchor chart examples that will help you see different ways that you can transform your anchor charts from being a piece of paper that hangs on the wall, that your students never look at, to a valuable tool your students use daily as a reference in their learning.
Keep in mind, the more student-centered the creation process is and the more students are involved, the more interactive and effective they’ll be!
I’ve created A LOT of anchor charts over the years. In fact, each of my guided math units for 1st-3rd grade includes anchor chart templates! I’ve chosen 5 of my all time favorite interactive anchor chart examples to share with you today that are all generic to help spark ideas and takeaways that you can use in your classroom right away!
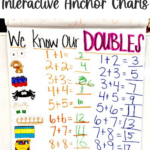
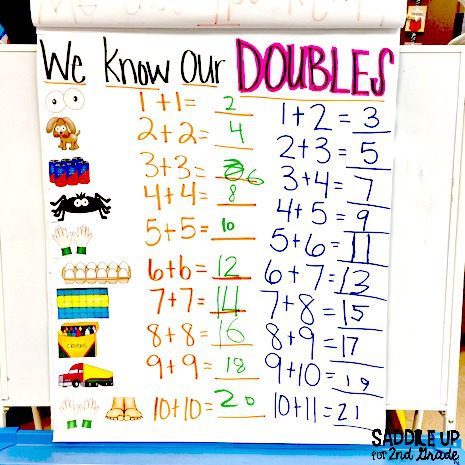
This is probably the most commonly used, obvious interactive anchor chart type… the Fill In The Blank Anchor Chart.
In this example, we were learning about doubles and doubles plus one facts. I paired kids up, assigned them a doubles fact, and hid the clip art images around the room. They had to work as a pair to find the image that matched their fact.
Once they found it, they glued it next to the fact on the anchor chart and solved the answer to the doubles and doubles plus one fact that matched.
This was done with a 1st grade class towards the beginning of the year, so I had the facts pre-written on the chart (so they wouldn’t take up the whole page to write one fact!). I do this same lesson with my 2nd graders and have them write their own facts and solve them.
The next anchor chart example is KWL Anchor Charts. These are often used for other subject areas, but they work perfect for math too. I have a generic KWL chart that I use when introducing a topic.
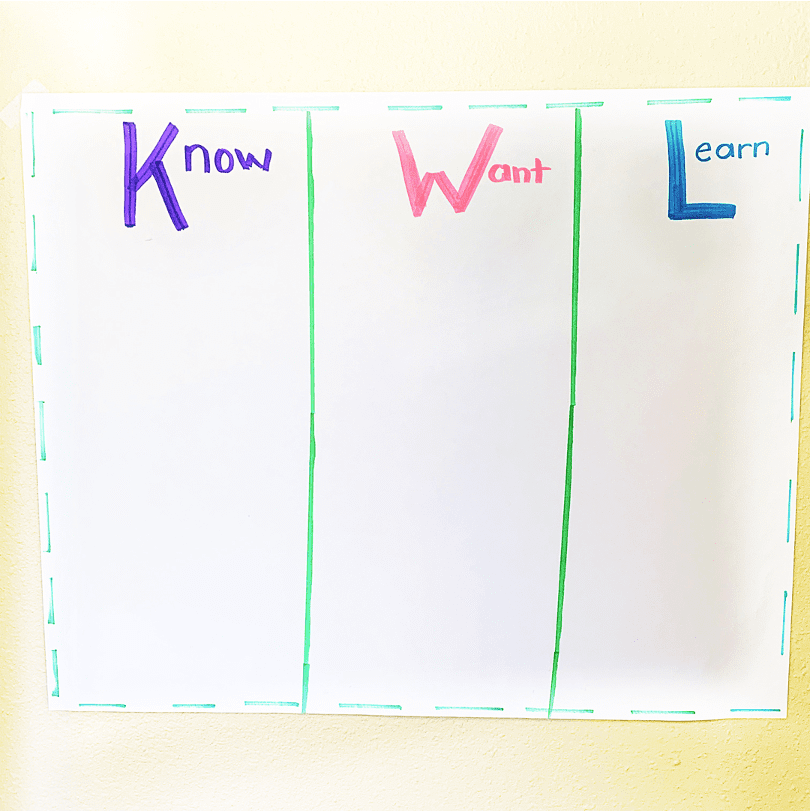
In this example, I was introducing place value to my 2nd grade class. I wanted them to make that math-to-math connection with something they already had prior knowledge on and expand on it.
I gave each student a sticky note and they had to write one thing they already knew about place value and place it on the K (know) side of our chart.
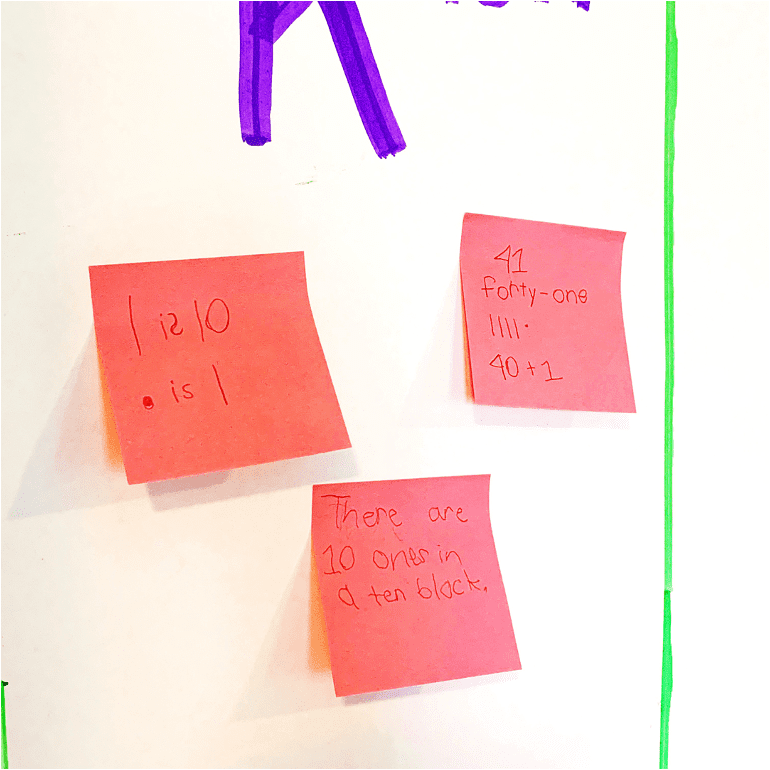
This also served as an informal assessment and allowed me to see what they already knew and what I needed to focus on in my upcoming lessons.
We repeated the process with the W (what) portion of our chart. They jotted down questions about what they wanted to learn during our unit. At the end of the unit, we added sticky notes to the L (learn) section to record what they learned.
It’s so fun to see their responses with how much they’ve learned throughout a unit. This really encourages students to reflect on their learning and think about the different parts of the unit.
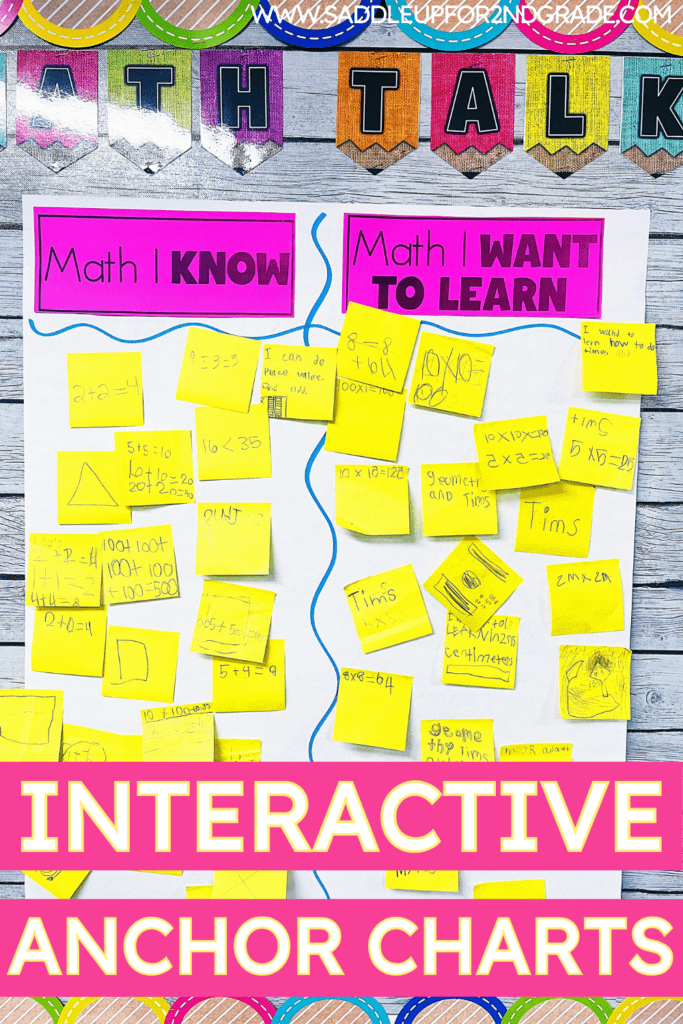
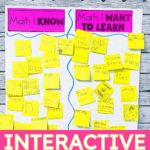
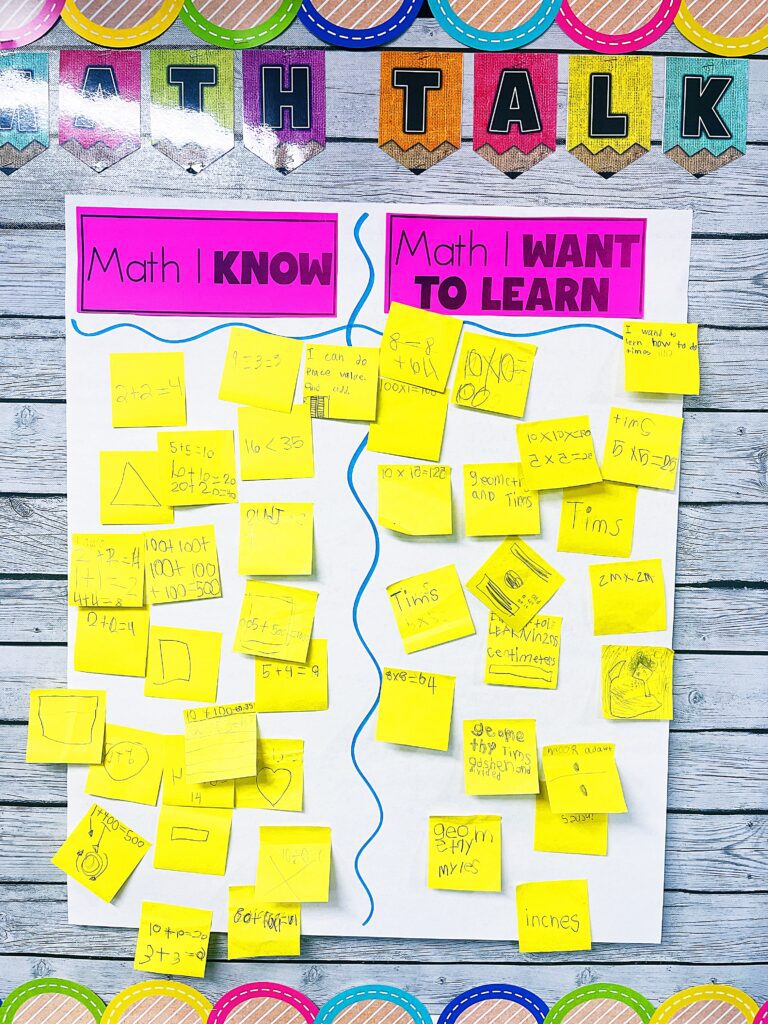
Another anchor chart example is a Know and Learn chart. I do this at the beginning of every school year. Students share something they already know about math on a sticky note and then share something they want to learn in 2nd grade.
The next anchor chart example is similar to a KWL Chart, and it’s called… a Brainstorming Anchor Chart! You can use this type of interactive anchor chart to help students make connections. I have a generic chart that I use in all subject areas.
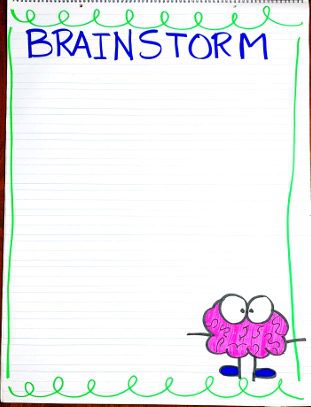
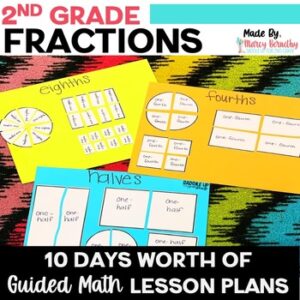
The example below is used with fractions. You can ask students what they think of when they hear the word fractions. They’ll draw or write their response and place it on the chart. This opens up the opportunity for conversations about topics and how they relate to each connection.
You can also create question webs that allow students to jot down what they want to know about a topic.
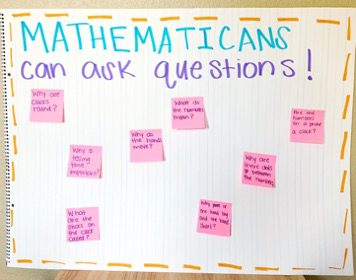
We are often so busy trying to rush through the curriculum that we don’t stop to ask students about what they want to know. By using a question web, it allows them to ask questions that you can respond to during whole group instruction, independently, or even spark questions between one another.
The last type of anchor chart I want to share is Graphic Organizers. With this type of anchor chart, the possibilities are literally endless!
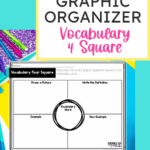
You can make t-charts, vocabulary 4 squares, and so much more. These are all great ways to engage your learners and allow them to get creative and take an active approach to their learning!
Try out this FREE Vocabulary 4 Square activity in your classroom by filling out the form below. It’ll be delivered straight to your inbox!
I hope this post has given you some simple and actionable ideas and examples so you can start using interactive anchor charts in your classroom!
You can grab the anchor charts shown for doubles and doubles plus one facts, as well as fractions, in my website store below!
Drop me a comment below and let me know which interactive anchor chart example you’re going to try first!